The Reports Overview page displays the reports of the complete
network and the devices connected to it.
Complete the following steps to view the
Reports Overview page.
On the navigation bar, select Business
Insights > Reports. The Reports page is displayed.
Click View on the Overview tile. The
Reports Overview page is displayed.
The Reports Overview page is the main page that displays an
overview of some important statistics of your Wi-Fi network.
The top right corner of the Reports
Overview page displays options to share and export reports in PDF and PNG
formats. You can also share them with recipients over e-mails on-demand or periodically
by configuring a schedule (daily, weekly and monthly). To download or create a schedule,
refer to Content Panel.
The data displayed on this page is based on the
selected date and time range. Use the Date and Time filter in the upper-right corner to select a predefined time
range or configure a custom date and time range. For more information, refer to Content Panel.
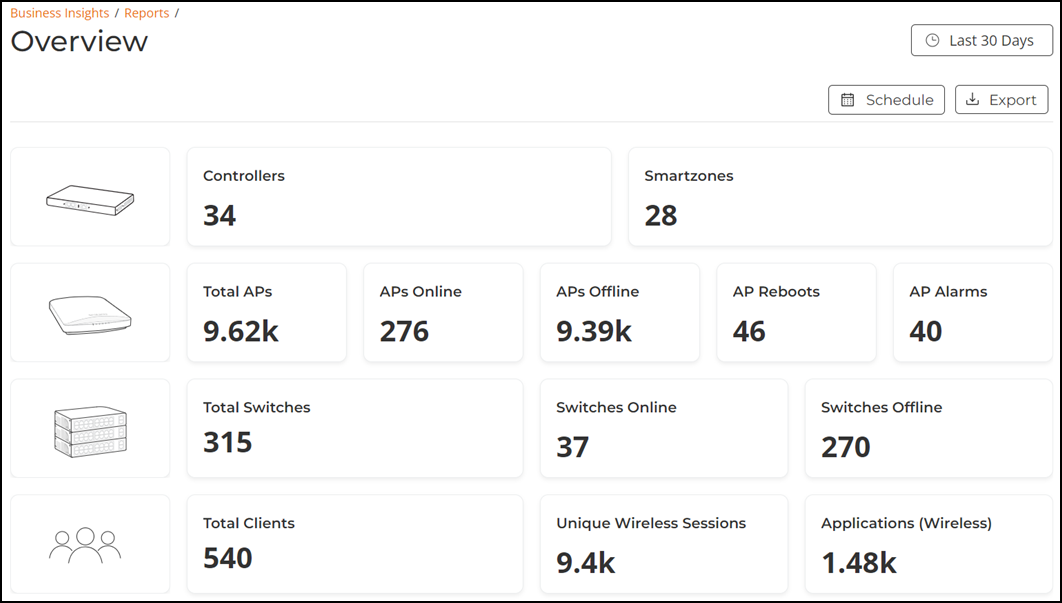
The top portion of the Reports
Overview shows the following tiles:
Controllers and
Smartzones: Displays the total count of controllers and
smartzones in the network for the selected time period.
Access Points: Displays the
current AP status and historical AP availability information, including the
total number of APs, online and offline AP counts, AP reboots, and AP alarms for
the selected time range. For more information, refer to Access Points Report.
Switches: Displays the current
switch status and historical switch availability information, including the
total number of switches and online and offline switch counts for the selected
time range. For more information, refer to Switches Report.
Clients: Displays the
total count of clients, unique wireless sessions, and wireless applications
accessed by the clients in the network for the selected time period. For more
information on wireless, refer to Wireless Report, and on
applications, refer to Applications Report.
Reports Overview Page - Top
Portion
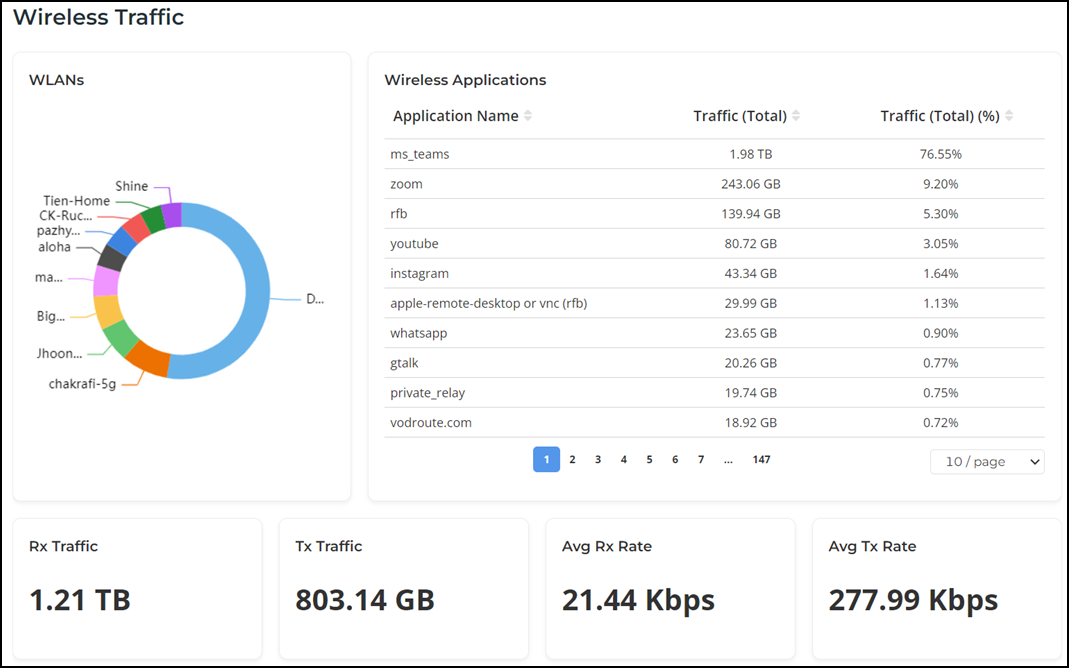
The bottom portion of the Reports
Overview shows the following Wireless Traffictiles:
WLANs:
Displays the top SSIDs by traffic for the selected time period in the
Date and Time filter. For more information, refer to
WLANs Report.
Pause the pointer over a portion of the donut to view the traffic data.
Wireless
Applications: Displays the applications being used more
frequently by the clients in the network for the selected time period in the
Date and Time filter. For more information, refer to
Applications Report. You
can select the number of applications displayed per page from the drop down at
the bottom of the page.
Rx Traffic:
Displays the total inbound traffic in the network for the selected time period
in the Date and Time filter.
Tx Traffic:
Displays the total outbound traffic from the network for the selected time
period in the Date and Time filter.
Average Rx
Traffic: Displays the average speed of the inbound traffic in the
network for the selected time period in the Date and Time
filter.
Average Tx
Traffic: Displays the average speed of the outbound traffic from
the network for the selected time period in the Date and
Time filter.
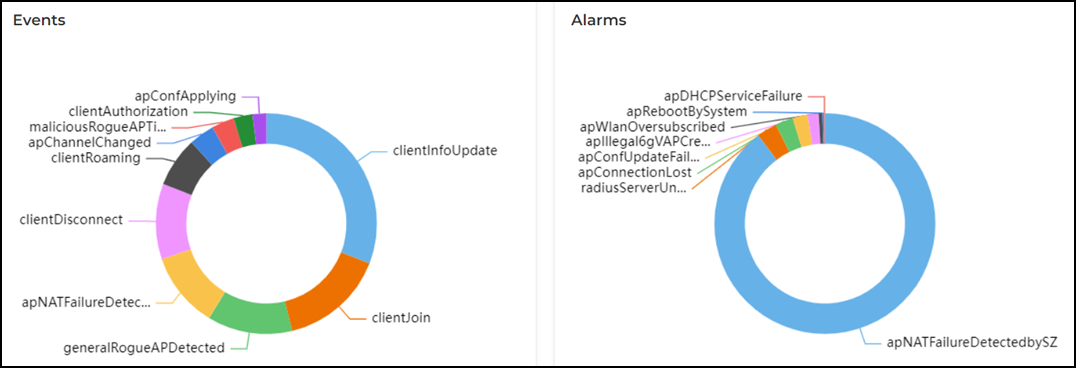
Events: Displays the top events occurred in the network for
the selected time period in the Date and Time filter. Pause
the pointer over a portion of the donut to view the event counts.
Alarms: Displays the top alarms occurred in the network for
the selected time period in the Date and Time filter. Pause
the pointer over a portion of the donut to view the alarm counts.