Wireless Report
The Wireless Report page provides details of traffic, clients, and trends by APs, SSIDs, radio, or clients over time.
- On the navigation bar, select . The Reports page is displayed.
- Click View on the Wireless Report tile. The Wireless Report page is displayed.
The Wireless Report page has the following components:
- Overview tile
- Top APs by Traffic tile
- Top APs by Client Count tile
- Network Usage Overview tile
- Traffic Trend tile
- Traffic Over Time Table
The data displayed on this page is based on the selected Date and Time filter and Network Hierarchy filter. Use the Date and Time filter in the upper-right corner to select a predefined time range or configure a custom date and time range. Use the Network Hierarchy filter to refine the displayed data by network scope. For more information, refer to Content Panel.
The top right corner of the page also displays options to download reports in PDF and PNG formats. You can also share the report via e-mails on-demand or periodically by configuring a schedule (daily, weekly, or monthly). For more information on how to create a schedule, refer to Content Panel.
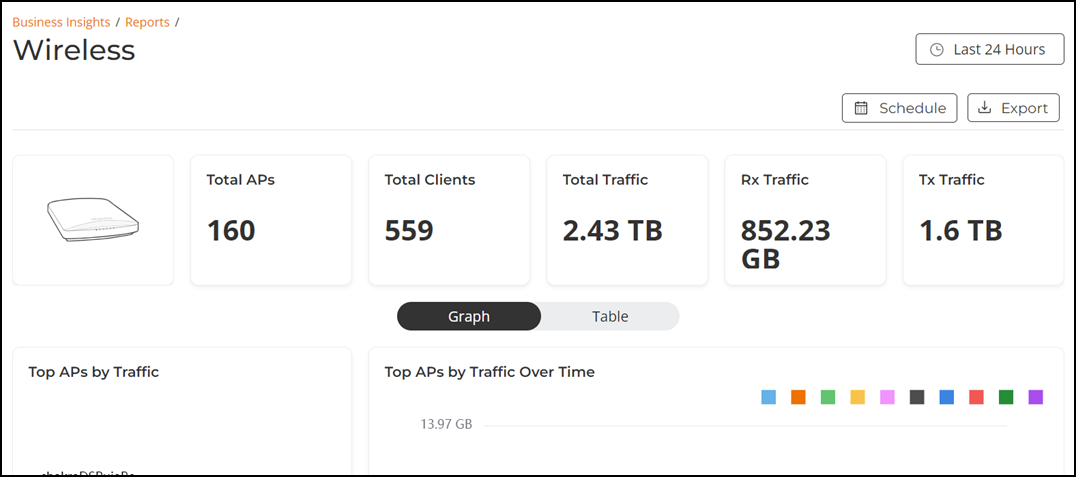
Overview Tile
- Current AP Status: Displays the total number of APs along with the number of APs currently online and offline based on the latest available AP status information. The timestamp of the latest status update is also displayed.
- AP Availability: Displays the total number of APs detected during the selected time range, including the number of APs that remained continuously online (Always Online) and APs that went offline at least once (Ever Offline) during the selected period.
- Current Clients : Displays the total number of clients currently connected based on the latest available client status information. The timestamp of the latest status update is also displayed.
- Clients (Time Range): Displays the total number of clients detected during the selected time range.
- Total Traffic: Displays the total traffic processed during the selected time range, including total transmitted (Tx) and received (Rx) traffic.
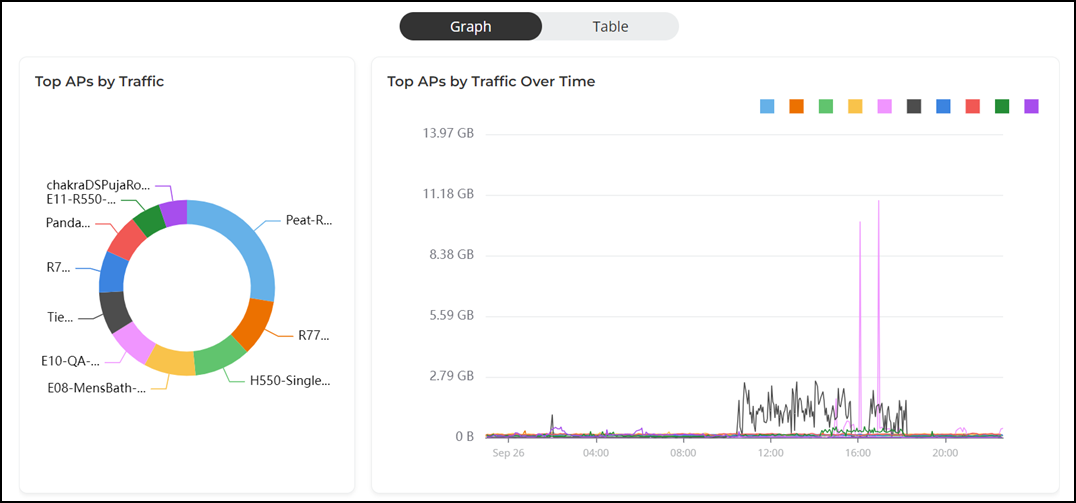
Top APs by Traffic Tile
The Top APs by Traffic tile contains two panes Top APs by Traffic and Top APs by Traffic Over Time.
The Top APs by Traffic pane displays a donut chart. The donut chart display the top 10 APs with highest traffic volume in your network for the selected time period in the Date and Time filter. Pausing the pointer over the chart displays an information box with the details of the selected AP.
The Top APs by Traffic Over Time pane displays a graph. The graph display the top 10 APs with highest traffic volume in your network for the selected time period in the Date and Time filter. Pausing the pointer over the graph displays an information box with the details of the selected AP at that time and date. Click any of the colored squares to hide the selected AP in the graph. The information icon that is hidden is displayed in gray.
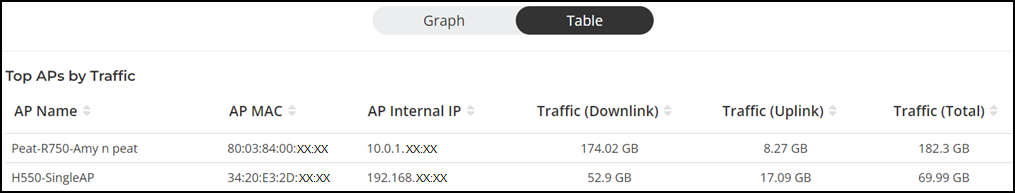
To view all the APs, click Table icon. The table is displayed with the AP name, MAC, internal IP, downlink traffic, uplink traffic, and total traffic information for the selected time period in the Date and Time filter. You can select the number of APs displayed in the table from the drop down at the bottom of the table.
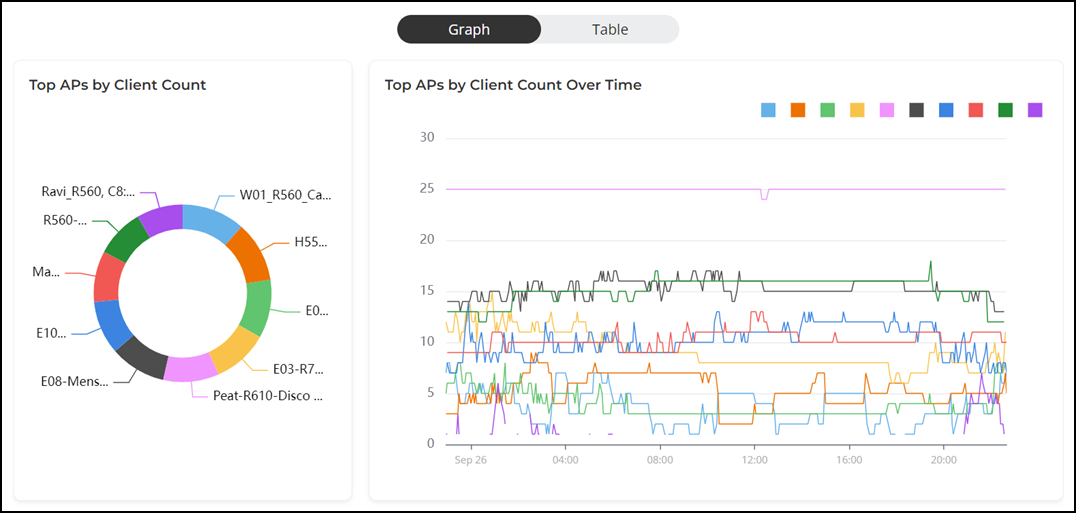
Top APs by Client Count Tile
The Top APs by Client Count tile contains two panes Top APs by Client Count and Top APs by Client Count Over Time.
The Top APs by Client Count pane displays a donut chart. The donut chart display the top 10 APs with the most clients on the network for the selected time period in the Date and Time filter. Pausing the pointer over the chart displays an information box with the details of the selected AP.
The Top APs by Client Count Over Time pane displays a graph. The graph display the top 10 APs with the most clients on the network for the selected time period in the Date and Time filter. Pausing the pointer over the graph displays an information box with the details of the selected AP at that time and date. Click any of the colored squares to hide the selected wired switch in the graph. The information icon that is hidden is displayed in gray.
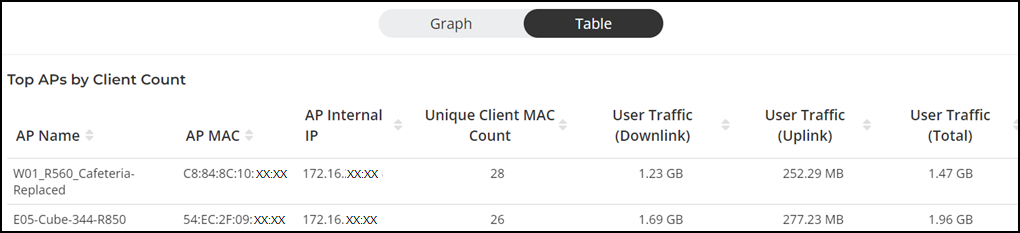
To view all the APs, click Table icon. The table is displayed with the AP name, MAC, internal IP, unique client MAC count, downlink user traffic, uplink user traffic, and total user traffic for the selected time period in the Date and Time filter. You can select the number of APs displayed in the table from the drop down at the bottom of the table.
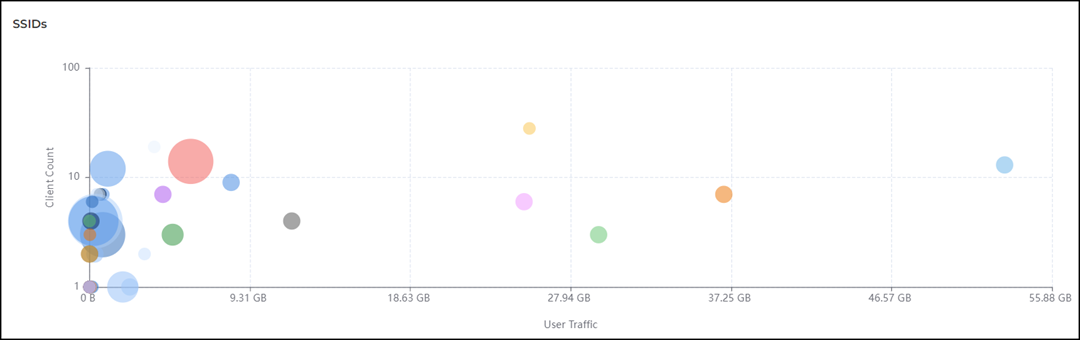
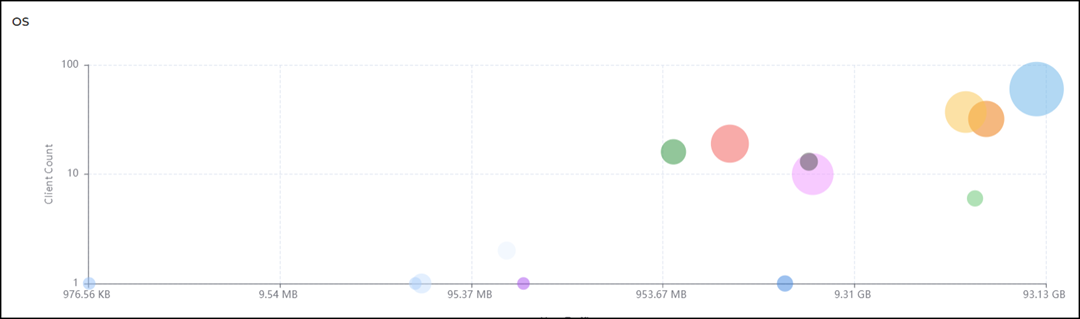
Network Usage Overview Tile
- SSIDs
- OS
The SSIDs tile facilitates analysis of the network usage across different SSIDs. Each bubble represents an SSID, with the X-axis showing the total amount of user traffic for each SSID and the Y-axis showing the number of unique client devices (MAC addresses) connected to each SSID. The size of each bubble typically corresponds to the number of Access Points (AP Count) associated with that SSID. Larger bubbles indicate SSIDs supported by more access points.
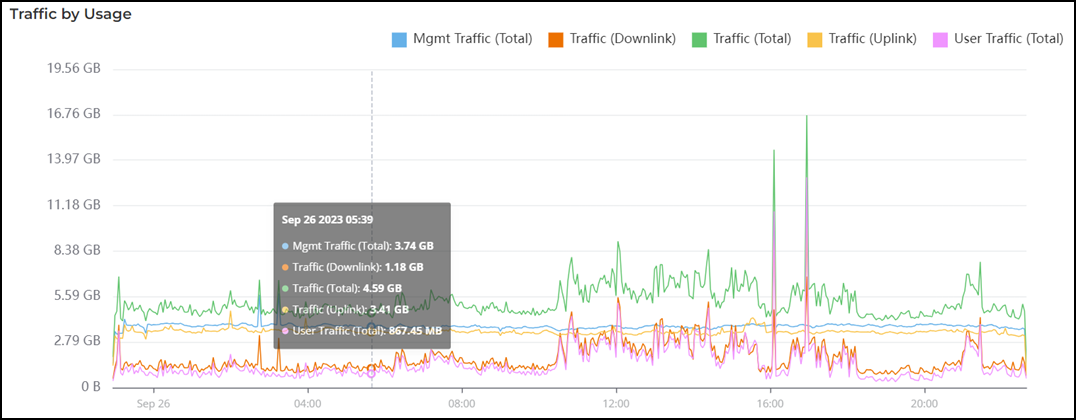
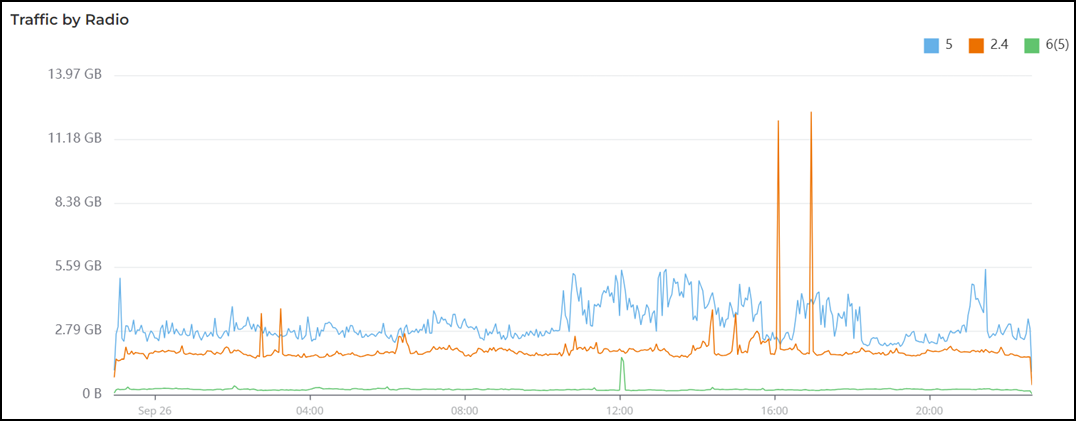
Traffic Trend Tile
- Traffic by Usage tile
- Traffic by Radio tile
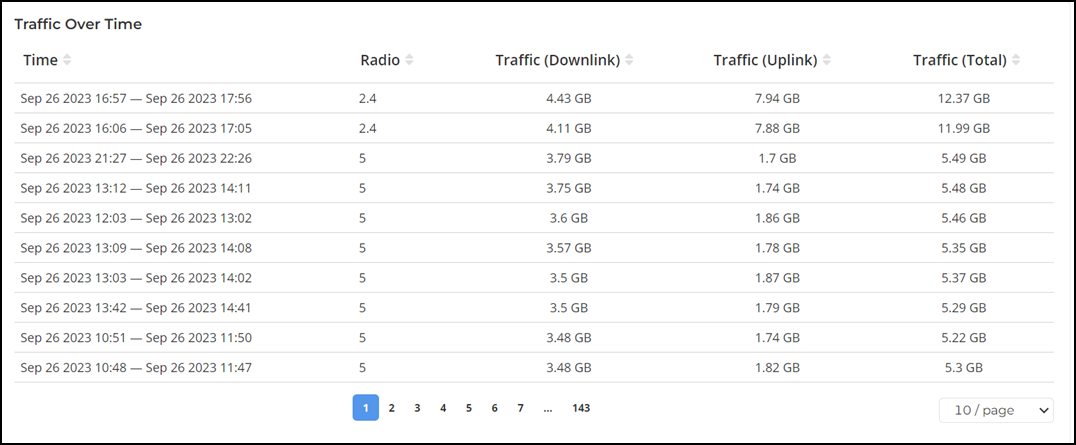
Traffic Over Time Table
The Traffic Over Time table displays the 2.4 GHz, 5 GHz, and 6(5) GHz radio traffic between time periods. This data is displayed only for the selected time period in the Date and Time filter. The table is displayed with the time, radio, downlink traffic, uplink traffic, and total traffic. You can select the number of time periods displayed in the table from the drop down at the bottom of the table.