WLANs Report
The WLANs Report page provides insights into SSID activity, client distribution, and traffic usage across WLANs. The page includes analytics for active SSIDs, client counts, traffic consumption, and SSID activity trends.
- On the navigation bar, select . The Reports page is displayed.
- Click View on the WLANs Report tile. The WLANs Report page is displayed.
The WLANs Report page has the following components:
- Overview tile
- Top SSIDs by Traffic tile
- Top SSIDs by Client Count tile
- Active SSIDs Trend tile
The data displayed on this page is based on the selected Date and Time filter and Network Hierarchy filter. Use the Date and Time filter in the upper-right corner to select a predefined time range or configure a custom date and time range. Use the Network Hierarchy filter to refine the displayed data by network scope. For more information, refer to Content Panel.
The top right corner of the page also displays options to download reports in PDF and PNG formats. You can also share the report via e-mails on-demand or periodically by configuring a schedule (daily, weekly, or monthly). For more information on how to create a schedule, refer to Content Panel.
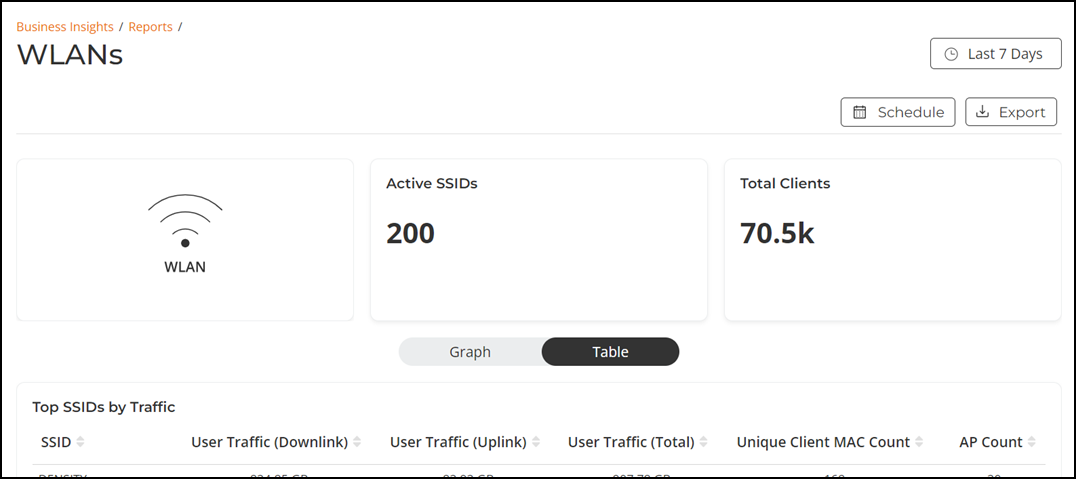
Overview Tile
- Active SSIDs: Displays the total number of SSIDs that were active during the selected time range.
- Current Clients : Displays the total number of clients based on the latest available client status information. The timestamp of the latest status update is also displayed.
- Clients (Time Range): Displays the total number of clients detected during the selected time range.
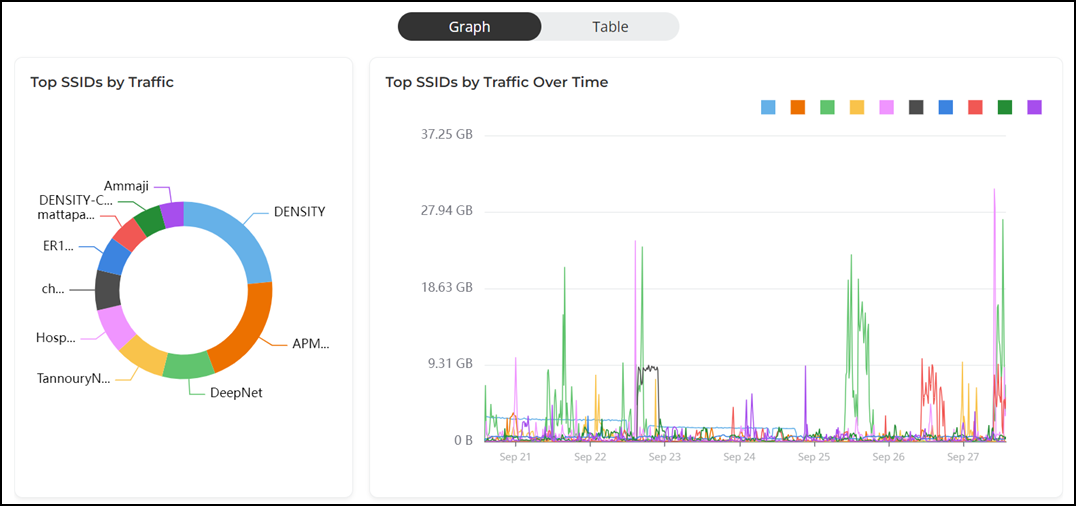
Top SSIDs by Traffic Tile
The Top SSIDs by Traffic tile contains two panes Top SSIDs by Traffic and Top SSIDs by Traffic Over Time.
The Top SSIDs by Traffic pane displays a donut chart. The donut chart display the top 10 most traffic generating wireless networks for the selected time period in the Date and Time filter. Pausing the pointer over the chart displays an information box with the details of the selected wireless network.
The Top SSIDs by Traffic Over Time pane displays a graph. The graph display the top 10 most traffic generating wireless networks for the selected time period in the Date and Time filter. Pausing the pointer over the graph displays an information box with the details of the selected wireless network at that time and date. Click any of the colored squares to hide the selected wireless network in the graph. The information icon that is hidden is displayed in gray.
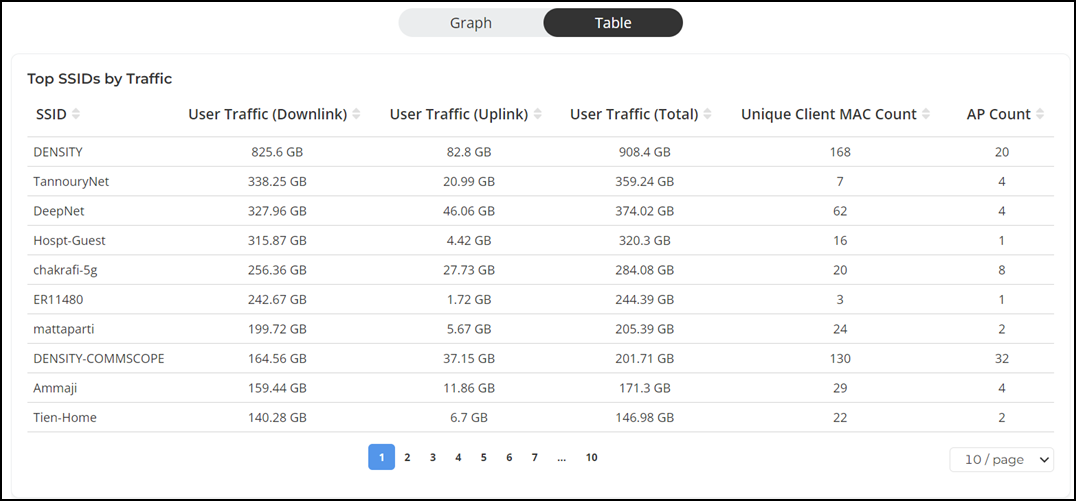
To view all the wireless network, click Table icon. The table is displayed with the SSID, downlink user traffic, uplink user traffic, total user traffic, unique client MAC count, and AP count information for the selected time period in the Date and Time filter. You can select the number of wireless network displayed in the table from the drop down at the bottom of the table.
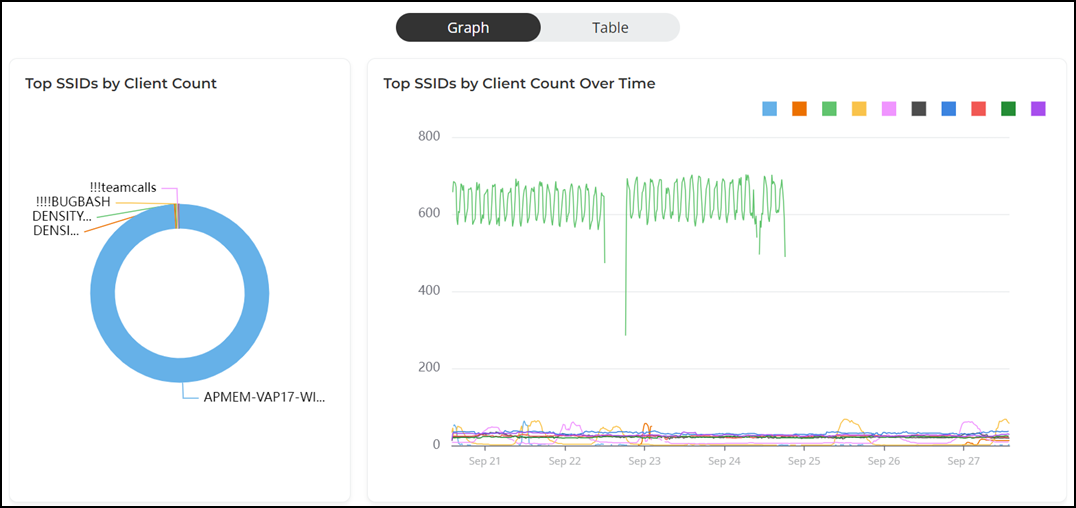
Top SSIDs by Client Count Tile
The Top SSIDs by Client Count tile contains two panes Top SSIDs by Client Count and Top SSIDs by Client Count Over Time.
The Top SSIDs by Client Count pane displays a donut chart. The donut chart display the top 10 most congested wireless networks in terms of client count for the selected time period in the Date and Time filter. Pausing the pointer over the chart displays an information box with the details of the selected wireless network.
The Top SSIDs by Client Count Over Time pane displays a graph. The graph display the top 10 most congested wireless networks in terms of client count for the selected time period in the Date and Time filter. Pausing the pointer over the graph displays an information box with the details of the selected wireless network at that time and date. Click any of the colored squares to hide the selected wireless network in the graph. The information icon that is hidden is displayed in gray.
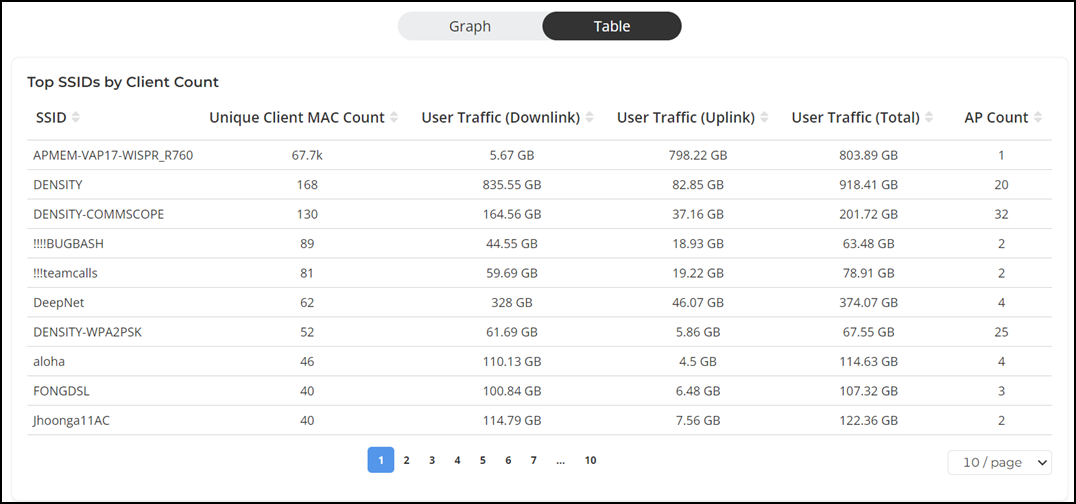
To view all the wireless networks, click Table icon. The table is displayed with the SSID, unique client MAC count, downlink user traffic, uplink user traffic, total user traffic, and AP count information for the selected time period in the Date and Time filter. You can select the number of wireless networks displayed in the table from the drop down at the bottom of the table.
Use the graph and table icons to toggle between the chart and table views.
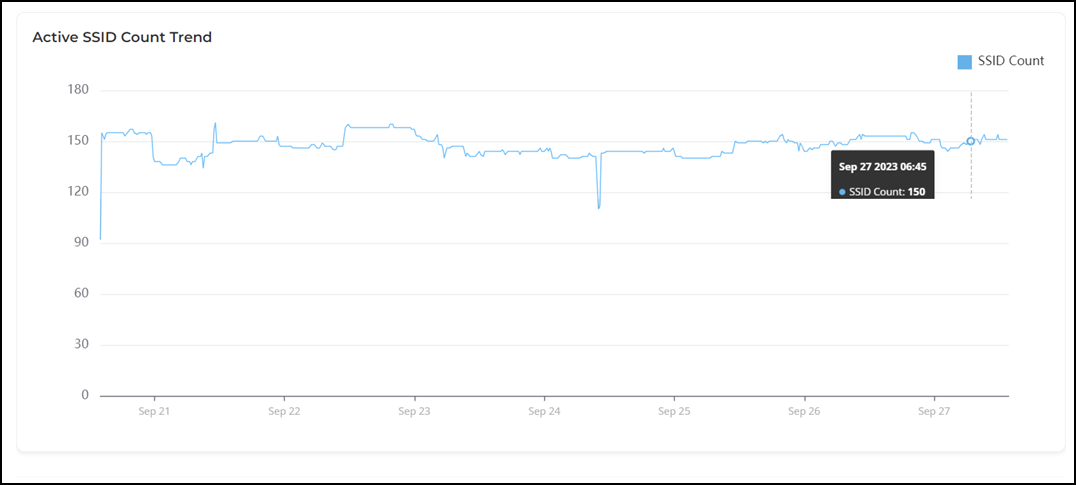
Active SSID Count Trend Tile
The Active SSID Count Trend tile contains a graph that displays the total active SSIDs count in the network for the selected time period in the Date and Time filter. Pausing the pointer over the graph displays an information box with the SSID count at that time and date.