Troubleshooting Client Connectivity Using the DSE Agent
You can use the RUCKUS Digital System Engineer (DSE) Client Troubleshooting Agent to analyze extensive telemetry and Packet Capture (PCAP) data, identify root causes of wireless client connectivity issues, and automatically generate RCA reports with likely causes, diagnostic details, and recommended actions.
DSE uses multiple sources to generate client‑level analysis in English. It supports incident types such as Authentication, Association, DHCP, EAP, and RADIUS. The DSE chat interface lists all active Client Troubleshooting processes running in the background. After a process finishes, you can open and review the generated report.
Complete the following steps to troubleshoot client connectivity issues using the DSE agent:
-
On the RUCKUS One web interface,
click the
 icon in the UI header.
The RUCKUS DSE welcome message appears in an interactive pop-up window.
icon in the UI header.
The RUCKUS DSE welcome message appears in an interactive pop-up window.Invoking the RUCKUS DSE 
-
In the input field, enter your
question about the client. Provide the Client MAC address and the relevant date
and time so that DSE can evaluate the client’s connectivity status. For example:
Why did client
80:39:8c:58:64:18 experience a connection issue on 2026-01-31 at
10am?
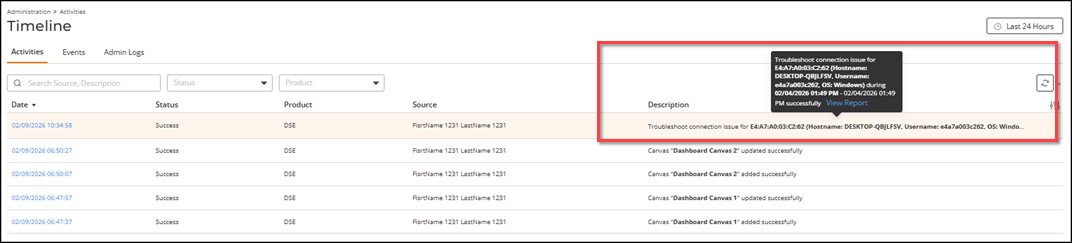
The DSE agent evaluates the client’s connectivity state for the specified time and generates a report. At any time, you may click Activity Details to view the basic details of your DSE request and the timeline of DSE efforts.
The following troubleshooting statuses can appear:- In Progress: When DSE is analyzing the client connectivity issue
- Success: When DSE completes the analysis and produces a report
- Failed: When DSE cannot investigate the issue for the given client or the specified date and time
DSE Troubleshooting Client Connectivity 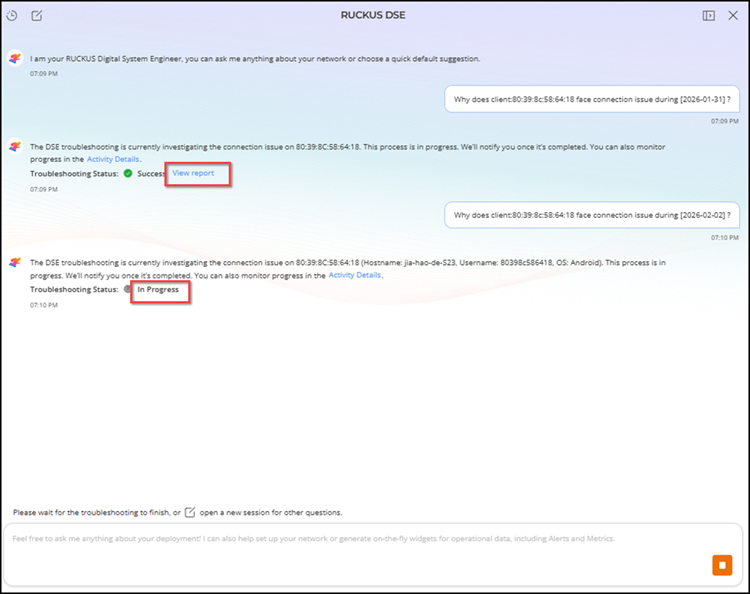
-
Click View report to open the report. The
Troubleshoot Connection Issue window is
displayed.
The report summarizes the findings for the selected client and time range. The report content and scope of information depends on the DSE agent's findings. Following are examples of reports, one in which the agent found no clear failure pattern and one in which the agent found multiple failure patterns.
In this example, the Symptoms and Observations section states that the system did not detect any failures, abnormal patterns, or conditions in the Wi‑Fi environment based on the available data. The Root Cause section confirms that the analysis did not identify any failure indicators or evidence of a specific cause for the client issue. It also notes that additional data or continued monitoring may be required before forming hypotheses.
Sample Report with No Failure Patterns 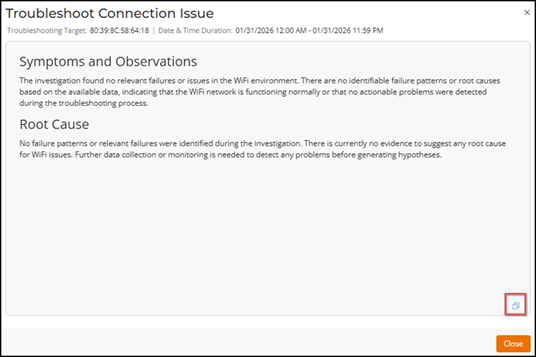 When the DSE agent analysis reveals identifiable failure patterns, the agent includes its hypotheses, root-cause details, and recommended actions in the report. Each hypothesis has a confidence score. In some cases, the report may include two or more hypotheses. The hypotheses are sorted by confidence score, with the highest score first.
Sample Report with Many Hypotheses - Root Cause Hypothesis 1 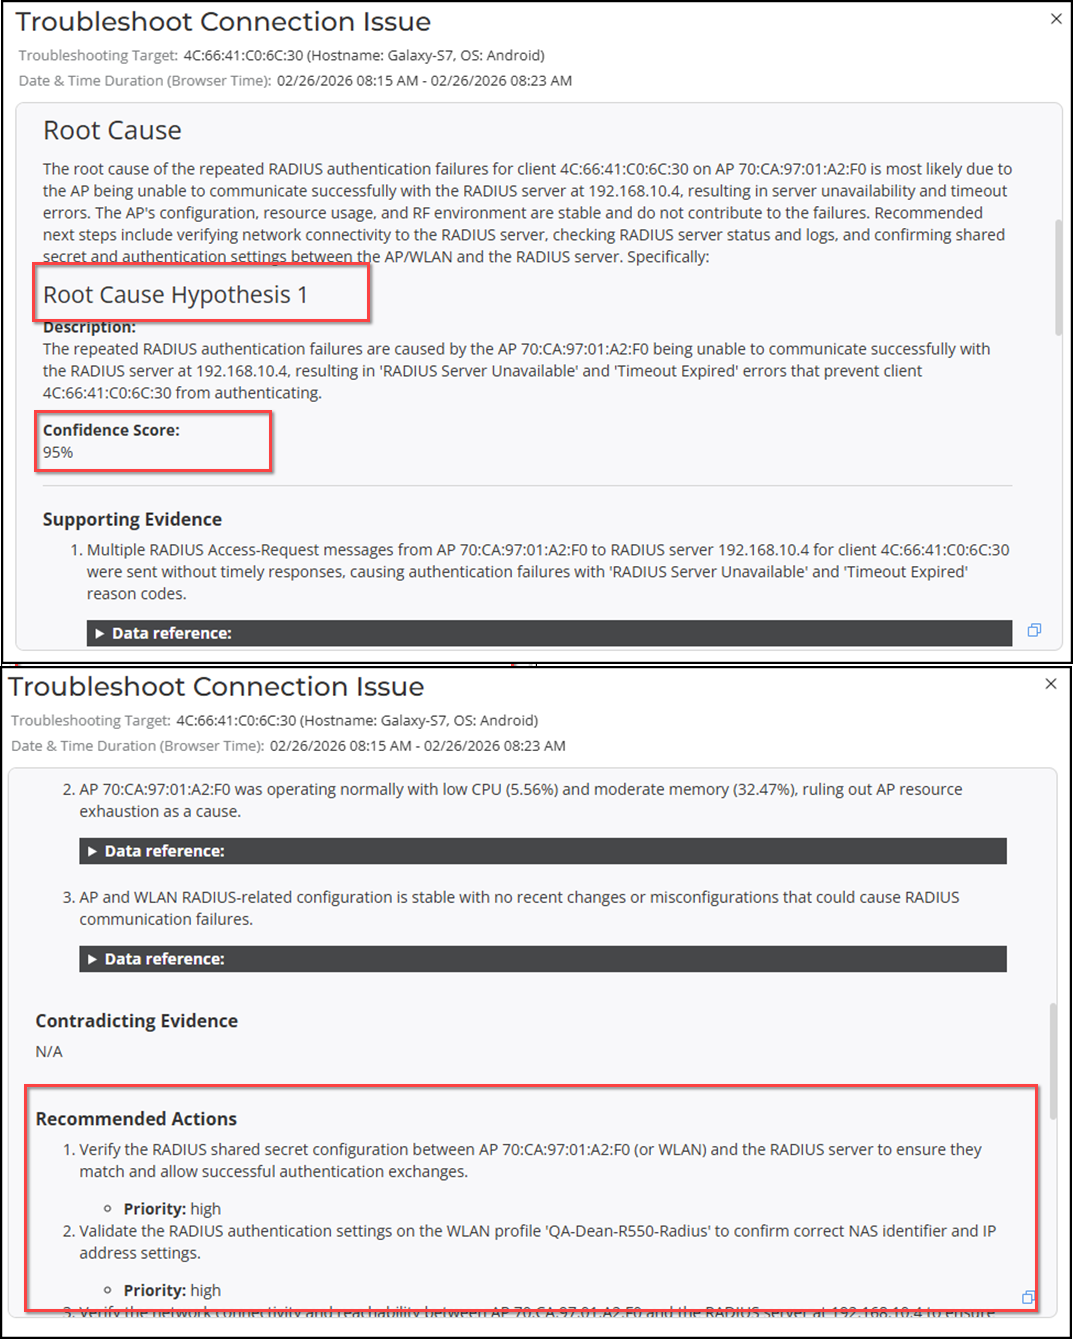
Sample Report with Many Hypotheses - Root Cause Hypothesis 2 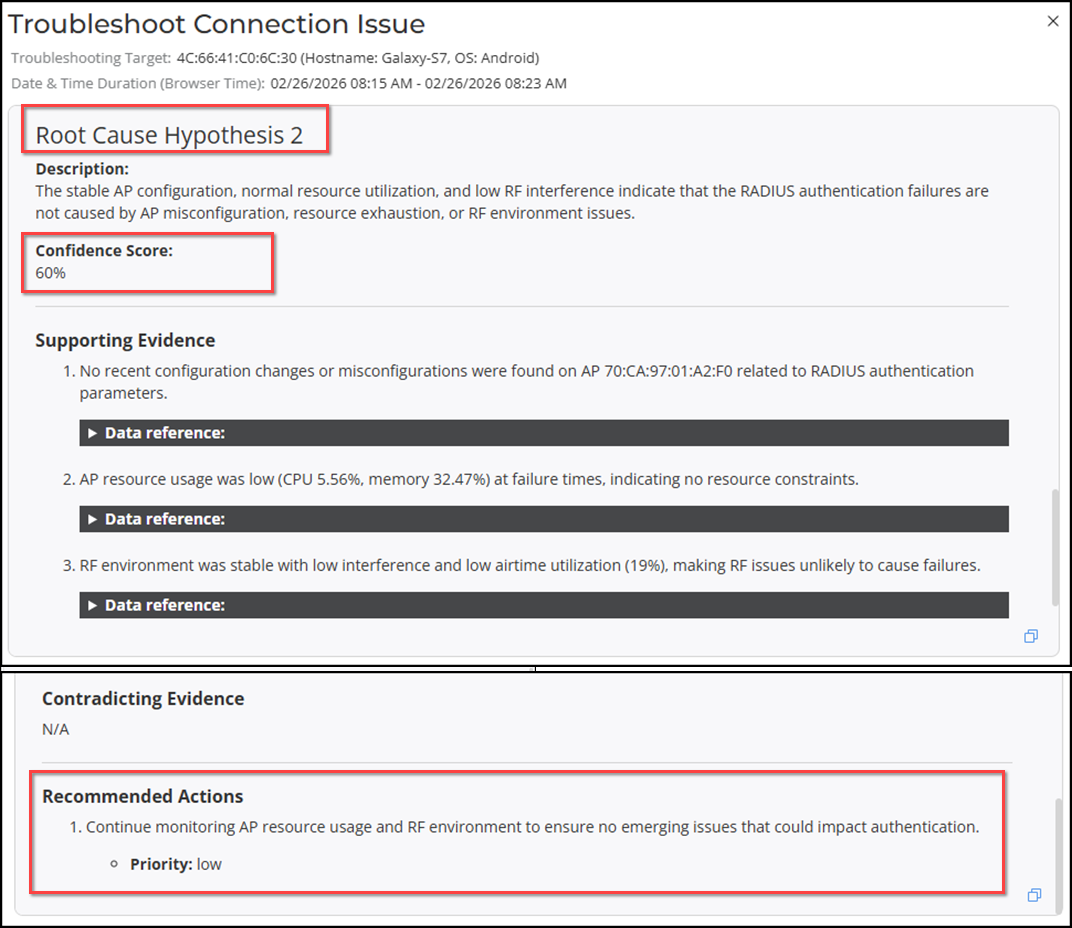
You can click the
 icon to copy the report content (as plain text) into your local system's
clipboard; you may then paste the report content into a local file of your
choosing.
icon to copy the report content (as plain text) into your local system's
clipboard; you may then paste the report content into a local file of your
choosing. You can also view the report from the page.
Viewing Reports from the Activities Page