Troubleshooting Wireless Clients
From the Clients page, you can troubleshoot the wireless clients.
-
Click the
Troubleshooting tab to view the following
components.
Wi-Fi Client: Troubleshooting Tab 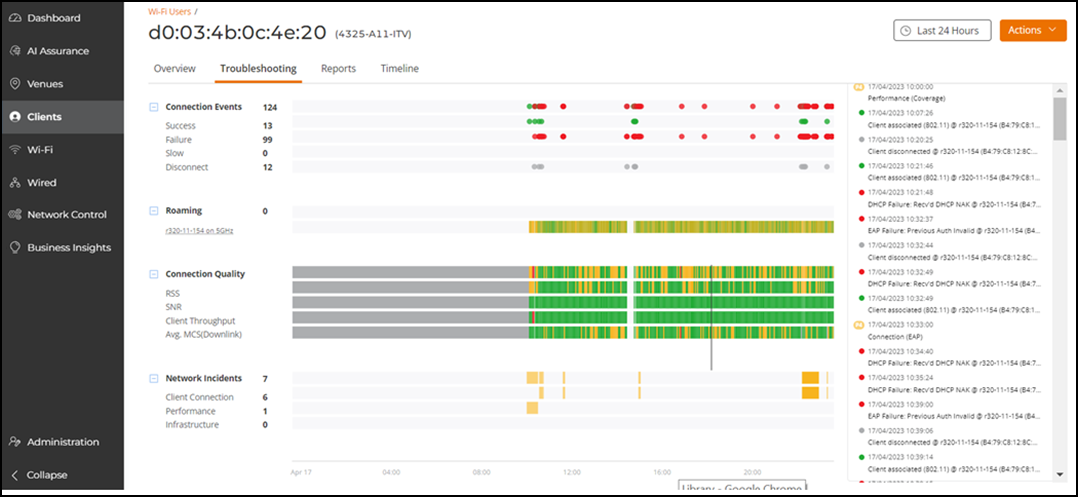
- Connection Events
- Roaming
- Connection Quality
- Network Incidents
- History
The data displayed is for the selected time period in the Date and Time filter. To improve performance, only the most recent set of events within the selected time range is shown, with older events truncated. To view events outside this window, adjust the date and time range accordingly.
You can also use the search field to filter the troubleshooting information based on the search criteria, such as categories, types, and radio bands.
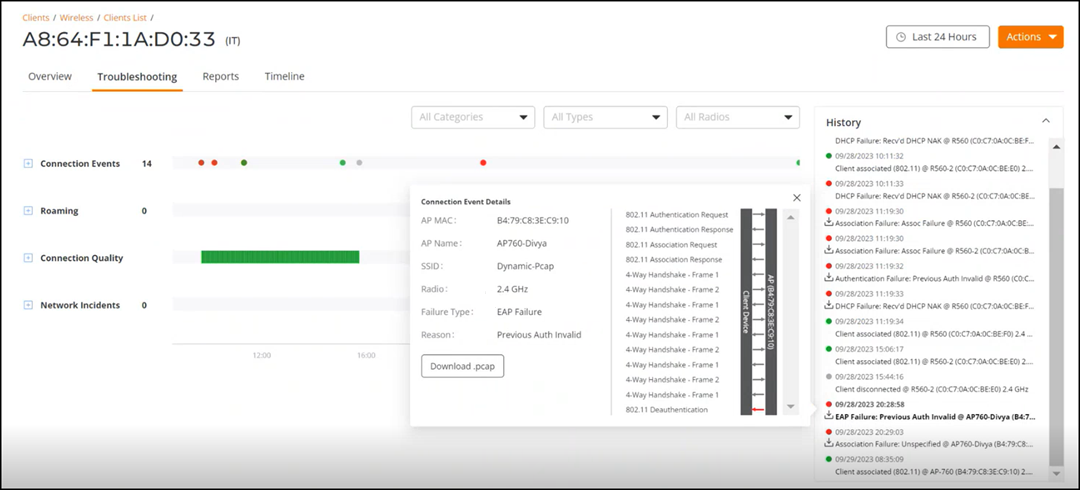
The Connection Events tile displays the connection status of the client on the particular WLAN for a specific AP for the selected time period in the Date and Time filter. The connection events are classified as success, failure, slow, disconnect, BTM request, and BTM response. These events are grouped under the Connection Events main header and indicated with the + icon. Click + icon to expand the group. The count of each connection event is displayed beside their name, along with a graph. BTM events reflect requests sent and received by the AP to optimize client connectivity. For APs running version 7.1.0.0.887 and later, the radio details for BTM events are populated, while earlier versions display them as unknown. Pausing the pointer over the graph displays an information box with the details of the selected events at that time and date. The connection events are identified with the following colors:- Green: Successful connection. Pause the pointer over the green dots to view more information such as the AP MAC address, AP name, SSID and Radio.
- Red: Failed connection. You can also click the red circle to view the time of the failure scenario (for example, whether the failure occurred during the EAP request, DHCP discovery, and so on). Pausing the pointer over the circle provides a quick snapshot of information such as the exact time of failure, the type of failure, the client IP address, connection diagram analyzing the point of failure and so on. The failed path is denoted by a red arrow.
- Yellow: Slow (long time to connect to connection).
- Gray: Disconnected.
The Roaming tile displays the connection events and detailed metrics of the client when it roams between multiple APs for the selected time period in the Date and Time filter. The count of connection event is displayed, along with a graph. Pausing the pointer over the graph displays an information box with the details of the events at that time and date. These details help in troubleshooting issues that arise when clients roam from one AP to another. A roaming event is identified with the following colors:- Green: Successful roam.
- Red: Failed connection.
- Yellow: Slow (long time to connect to connection).
- Gray: Disconnected.
The Connection Quality tile displays the quality of the service the client experiences throughout the network for the selected time period in the Date and Time filter. The connection quality is classified as RSS, SNR, client throughput, and average MCS downlink. These connection qualities are grouped under the Connection Quality main header and indicated with the + icon. Click + icon to expand the group. A graph is displayed beside their name, pausing the pointer over the graph displays an information box with the details of the connection qualities at that time and date. The connection quality is identified with the following colors:- Green: Good
- Red: Poor
- Yellow: Average
The Network Incidents tile displays any incidents that affected the client for the selected time period in the Date and Time filter. The incidents are classified as client connection, performance, and infrastructure. These connection qualities are grouped under the Network Incidents main header and indicated with the + icon. Click + icon to expand the group. The count of each incident is displayed beside their name, along with a graph. Pausing the pointer over the graph displays an information box with the details of the selected incidents at that time and date. The incidents are identified with the following colors and severities:- Red: P1
- Dark Orange: P2
- Orange: P3
- Yellow: P4
The History tile displays the history of events that occurred for this client, along with the date and time of association, severity, date and time of the events, event status, and failure events PCAP report. The data displayed is for the selected time period in the Date and Time filter. It shows the client connected and disconnected events, the network incidents, and so on. Clicking on any network incident in the History tile directs you to the Incident Details page.
RUCKUS One supports the dynamic predictive packet capture (PCAP) feature on the APs that runs the firmware version 6.2.3.103.235 or higher. For every client failture such as authentication failure, DHCP failure, a PCAP is generated. By default, this feature is enabled.
Complete the following steps to view the dynamic PCAP for a wireless client.
-
Under History, select an event to view details.
Viewing PCAP Details