AP Insights
The AP Insights page provides detailed, time-range-based analytics and operational information for the selected AP.
-
Click
Insights tab. The AP Insights page
is displayed.
AP Insights 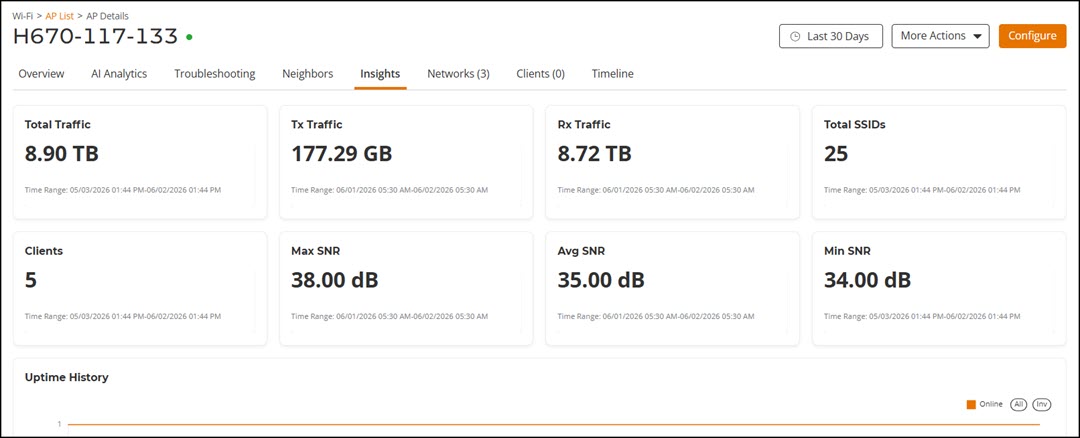 The AP Insights page has the following components:
- Overview tile
- Uptime History tile
- Traffic Trend tile
- Unique Clients Trend Over Time tile
- Top Clients by Traffic Volume tile
- Top Clients by Traffic Volume Over Time tile
- Top Applications by Traffic tile
- Sessions Table
- RSS Trend tile
- SNR Trend tile
- Airtime Utilization Trend tile
- Client Details table
- Alarms table
- Events table
The data displayed on this page is based on the selected date and time range. Use the Date and Time filter in the upper-right corner to select a predefined time range or configure a custom date and time range.
Overview Tile
Uptime History Tile
The Uptime History tile contains a graph that displays the online and offline status of the selected AP over time for the selected time period in the Date and Time filter. Pausing the pointer over the graph displays an information box with the online and offline status at that time and date. You can hide any of this information displayed in the graph by clicking the Online or Offline icon at the top of the graph. The information icon that is hidden is displayed in gray.
Traffic Trend Tile
- Traffic by Usage tile
- Traffic by Radio tile
Traffic by Usage: This tile contains a graph that displays the traffic by usage over time for the selected time period in the Date and Time filter. The graph displays the information of the total management traffic, total downlink traffic, total uplink traffic, total traffic, and total user traffic. Pausing the pointer over the graph displays an information box with the details of the traffic at that time and date. Click any of the colored squares to hide the selected traffic in the graph. The information icon that is hidden is displayed in gray.
Traffic by Radio: This tile contains a graph that displays the traffic by radio over time for the selected time period in the Date and Time filter. The graph displays the total traffic information for 2.4 GHz, 5 GHz, or 6(5) GHz radio band that is configured on the selected AP. Pausing the pointer over the graph displays an information box with the details of the radio bands at that time and date. Click any of the colored squares to hide the selected radio in the graph. The information icon that is hidden is displayed in gray.
Unique Clients Trend Over Time Tile
- Client Count
- Traffic
Unique Clients Trend Over Time by Client Count: This tile contains a graph that displays the count of clients connected to the selected AP over time along with the 2.4 GHz, 5 GHz, or 6(5) GHz radio band information that is configured on the selected AP. The data displayed is for the selected time period in the Date and Time filter. Pausing the pointer over the graph displays an information box with the details of AP at that time and date. Click any of the colored squares to hide the selected radio types in the graph. The information icon that is hidden is displayed in gray.
Unique Clients Trend Over Time by Traffic: This tile contains a graph that displays the unique clients by traffic over time. The data displayed is for the selected time period in the Date and Time filter. Pausing the pointer over the graph displays an information box with the details of the traffic at that time and date. Click any of the colored squares to hide the selected traffic in the graph. The information icon that is hidden is displayed in gray.
Top Clients by Traffic Volume Tile
The Top Clients by Traffic Volume tile contains a donut chart that displays the top 10 clients that have generated the largest volume of traffic over this AP for the selected time period in the Date and Time filter. Pausing the pointer over the chart displays an information box with the details of the selected client.
Top Clients by Traffic Volume Over Time Tile
The Top Clients by Traffic Volume Over Time tile contains a graph that displays the top 10 clients that have generated the largest volume of traffic over this AP for the selected time period in the Date and Time filter. Pausing the pointer over the graph displays an information box with the client details at that time and date. Click any of the colored squares to hide the selected client details in the graph. The information icon that is hidden is displayed in gray.
Top Applications by Traffic Tile
The Top Applications by Traffic tile contains two panes Top Applications by Traffic and Top Applications by Traffic Over Time.
The Top Applications by Traffic pane displays a donut chart. The donut chart display the top 10 applications with the largest traffic in the AP, along with the received and transmitted traffic for the selected time period in the Date and Time filter. Pausing the pointer over the chart displays an information box with the details of the selected application.
The Top Applications by Traffic Over Time pane displays a graph. The graph display the top 10 applications with the largest traffic in the AP, along with the received and transmitted traffic for the selected time period in the Date and Time filter. Pausing the pointer over the graph displays an information box with the details of the application at that time and date. Click any of the colored squares to hide the selected application in the graph. The information icon that is hidden is displayed in gray.
To view all the applications, click Table icon. The table is displayed with the application name, port, downlink traffic, uplink traffic, and total traffic for the selected time period in the Date and Time filter. You can select the number of applications displayed in the tile from the drop down at the bottom of the table.
Use the graph and table icons to toggle between the chart and table views.
Sessions Table
The Sessions table displays information on the number of client sessions specified for this AP between time periods. This data is displayed only for the selected time period in the Date and Time filter. The table displays attributes such as first connection, disconnection time, session duration, host name, SSID, radio, inbound user (Rx), outbound user (Tx), and user traffic. You can control the number of APs displayed in the table from the drop down at the bottom of the table.
RSS Trend Tile
The RSS Trend tile contains a graph that displays the received signal strength trends over time for this AP. This data is displayed only for the selected time period in the Date and Time filter. Pausing the pointer over the graph displays an information box with the RSS details at that time and date. Click any of the colored squares to hide the selected RSS details in the graph. The information icon that is hidden is displayed in gray.
SNR Trend Tile
The SNR Trend tile contains a graph that displays the signal-to-noise ratio over time for this AP. This data is displayed only for the selected time period in the Date and Time filter. Pausing the pointer over the graph displays an information box with the SNR details at that time and date. Click any of the colored squares to hide the selected SNR details in the graph. The information icon that is hidden is displayed in gray.
Airtime Utilization Trend Tile
The Airtime Utilization Trend tile contains a graph that displays the information about the APs average airtime utilization on the 2.4 GHz, 5 GHz, or 6(5) GHz radio for the selected time period in the Date and Time filter. Pausing the pointer over the graph displays an information box with the average airtime details at that time and date. Click any of the colored squares to hide the selected details in the graph. The information icon that is hidden is displayed in gray. Graphs are displayed for each band (2.4 GHz, 5 GHz, and 6(5) GHz). The graph data is displayed only for the band that is configured on the AP and the other graph tabs are empty. Use the 2.4 GHz, 5 GHz, and 6(5) GHz icons to toggle between the graphs.
Clients Details Table
The Clients Details table displays the list of clients with the highest traffic volume in the selected AP for the selected time period in the Date and Time filter. The table displays attributes such as hostname, AP internal IP, username, session count, downlink user traffic, uplink user traffic, and total user traffic (sum of Rx and Tx). You can select the number of hostname displayed in the table from the drop down at the bottom of the table.
Events Table
The Events table displays the list of events that have occurred in the selected AP for the selected time period in the Date and Time filter. The table displays attributes such as time, event code, event type, and event reason. You can select the number of events displayed in the table from the drop down at the bottom of the table.