Viewing Activities
You can view the activities associated with your RUCKUS One account, including adding, modifying, and deleting devices, networks, services, and so on. Activity events include an audit log of the steps taken as part of the activity, as well as the time required to perform each action and the success or failure of each step within the activity.
-
On the navigation bar, select
.
The Activities page is displayed.
Timeline - Activities Tab 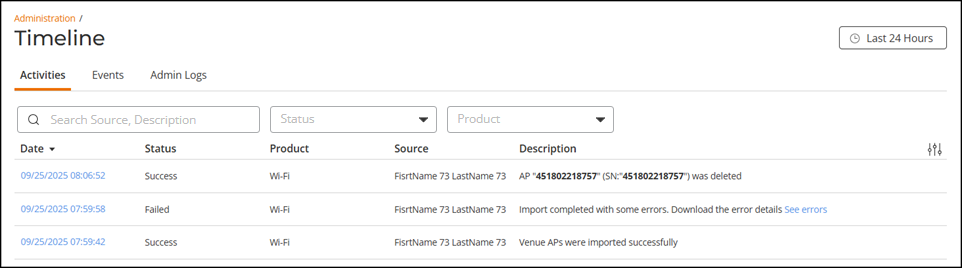
-
The Activities page displays the
following information:
- Date: Date and time when the activity was performed.
Click the timestamp link to view additional Activity
Details.
The Activity Details sidebar is displayed with the following information:
- Start Time
- End Time
- Severity
- Event Type
- Description
- Step Status Timeline
- Current StatusNote: For failed activities, click the
 icon to view the error message.
A Copy to clipboard option is available to
aid your sharing information. Close the error message pop-up
window by clicking the
icon to view the error message.
A Copy to clipboard option is available to
aid your sharing information. Close the error message pop-up
window by clicking the  icon.
icon. Activity Details - Failed and Success Status Examples 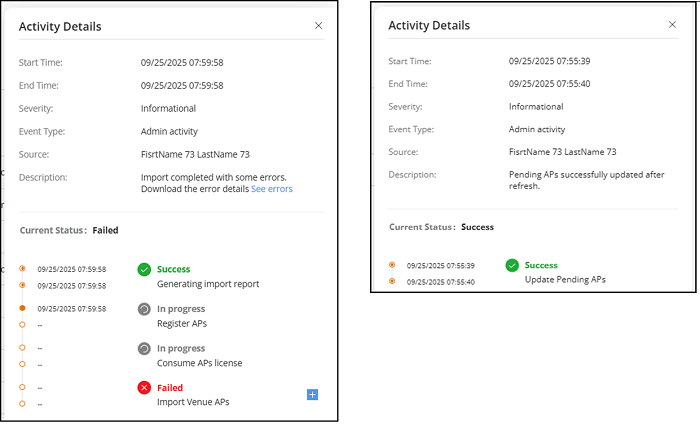
- Status: Displays the status of the activity and can be Pending, In progress, Success, or Failed.
- Product: Displays the functional area of the RUCKUS One management platform and can be General, Switch, RUCKUS Edge, or Wi-Fi.
- Source: Displays the name or email address associated with the RUCKUS One user that triggered the activity.
- Description: Displays a brief description of the
activity. In case of an error, click on See errors
hyperlink to download the CSV report to your local system.
You can filter the timeline list by selecting one of the time range options: Last 24 Hours, Last 7 Days, Last 30 Days, or Custom Range.
Additionally, you can filter the list by selecting one of the options from the drop-down menu of the Status and Product fields. The statuses include Pending, In progress, Success, or Failed. The Product options are General, Switch, Wi-Fi, or RUCKUS Edge.
You can customize which fields appear in the Timeline table by clicking the
 icon and selecting or deselecting the
desired column names. Optionally, you can click Reset to default
to restore the default subset of columns.
icon and selecting or deselecting the
desired column names. Optionally, you can click Reset to default
to restore the default subset of columns.You can search the Activities timeline using the Source and Description information, and filter the activity list by Status and Product.
You can click the
 icon in the top-right corner of the RUCKUS One web interface to view
notifications either as a list or grouped into a toast notification. This
feature helps prevent notification overload—especially when background APIs
are running or during nightly radio adjustments—by reducing excessive
messages that can clutter the dashboard.The grouped toast notification mechanism consolidates multiple success or failure notifications into a single toast notification, showing the remaining count and directing users to the Activities page for details. Additionally, Sleep Toast Notifications is an optional setting that allows you to disable toast notifications when needed.
icon in the top-right corner of the RUCKUS One web interface to view
notifications either as a list or grouped into a toast notification. This
feature helps prevent notification overload—especially when background APIs
are running or during nightly radio adjustments—by reducing excessive
messages that can clutter the dashboard.The grouped toast notification mechanism consolidates multiple success or failure notifications into a single toast notification, showing the remaining count and directing users to the Activities page for details. Additionally, Sleep Toast Notifications is an optional setting that allows you to disable toast notifications when needed.Grouping Notifications 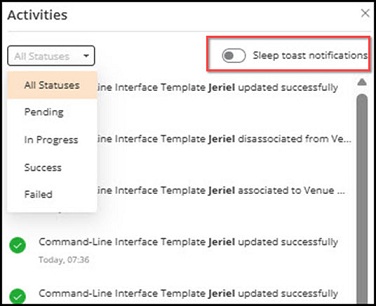
- Date: Date and time when the activity was performed.
Click the timestamp link to view additional Activity
Details.