Viewing Network Health
The MDU 360 dashboard provides insights into network health and performance to help property managers and service providers maintain reliability and connectivity.
-
Select the Network
Overview tab. The following widgets are displayed:
MDU 360 Dashboard - Network Overview Tab 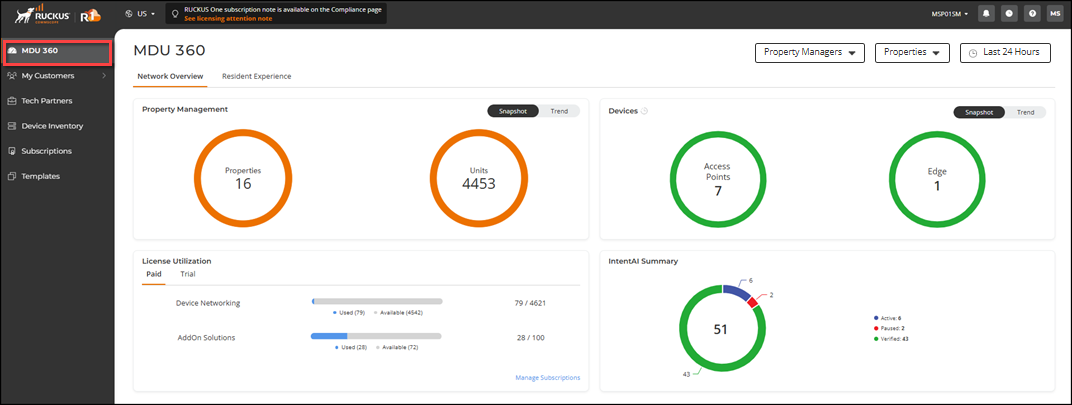
- Property
Management: This widget displays a summary of the total
number of properties configured in your MDU network and the total number
of units associated with those properties. You can further refine the
displayed data using both dashboard and widget filters.
Click the Properties count to display the Properties sidebar and review the list of properties and associated unit counts. You can use the Search option to display only the table entries matching the specified property; enter a minimum of two characters. You can customize which fields appear in the table by clicking the
 icon and selecting or deselecting the
desired column names. Optionally, you can click Reset to
default to have the default subset of columns. Click
Clear
Filters to reset the filters. You can sort the list
by clicking the associated column header.
icon and selecting or deselecting the
desired column names. Optionally, you can click Reset to
default to have the default subset of columns. Click
Clear
Filters to reset the filters. You can sort the list
by clicking the associated column header.Click the Units count to display the Apartment Units sidebar and review the list of unit names as well as the resident name and contact information associated with each unit. You can use the Search option to display only the table entries matching the specified Unit Name or Resident Name; enter a minimum of two characters. You can customize which fields appear in the table by clicking the
icon and selecting or deselecting the
desired column names. Optionally, you can click Reset to
default to have the default subset of columns. Click
Clear
Filters to reset the filters. You can sort the list
by clicking the associated column header. - IntentAI Summary: This widget provides an overview of IntentAI’s performance in managing network operations autonomously. IntentAI uses AI/ML-driven algorithms to execute tasks through predefined network intents.
- Device - Snapshot: This widget displays the status and total number of all APs, switches, and RUCKUS Edge devices across the selected Property Manager or MSP Customers. Each device type has its own real-time status displayed as a pie chart reflecting both Online (green) and Offline (red) statuses and displaying the total number of devices of that type.
- Device - Trend: This widget displays a line graph showing a historical view of the total number of Online devices only; lines are color-coded line for each device type and the trend time range is based on the Date/Time filter at the top of the GUI. Additionally, you can toggle the visibility of individual device data in the line graph by selecting or deselecting the color-coded checkbox next to each device.
The MDU 360 Dashboard provides an aggregated view across customers and their properties. It also enables users to drill down into individual properties to assess network performance and resident experience. Use filters to refine the view: Property Manager filter lists all MSP Customers and Property filter lists all the Venues under each MSP Customer. Date/Time filters are also available for further customization.
Widgets showing historical data are marked with a
 icon next to their title for easy identification.
 - Property
Management: This widget displays a summary of the total
number of properties configured in your MDU network and the total number
of units associated with those properties. You can further refine the
displayed data using both dashboard and widget filters.