Viewing Resident Experience
The MDU 360 dashboard provides insights into resident network usage, connectivity quality, and service responsiveness—helping property managers and service providers maintain high satisfaction and proactively address performance issues.
-
Select the Resident Experience tab. The following widgets
are displayed:
MDU 360 Dashboard - Resident Experience Tab 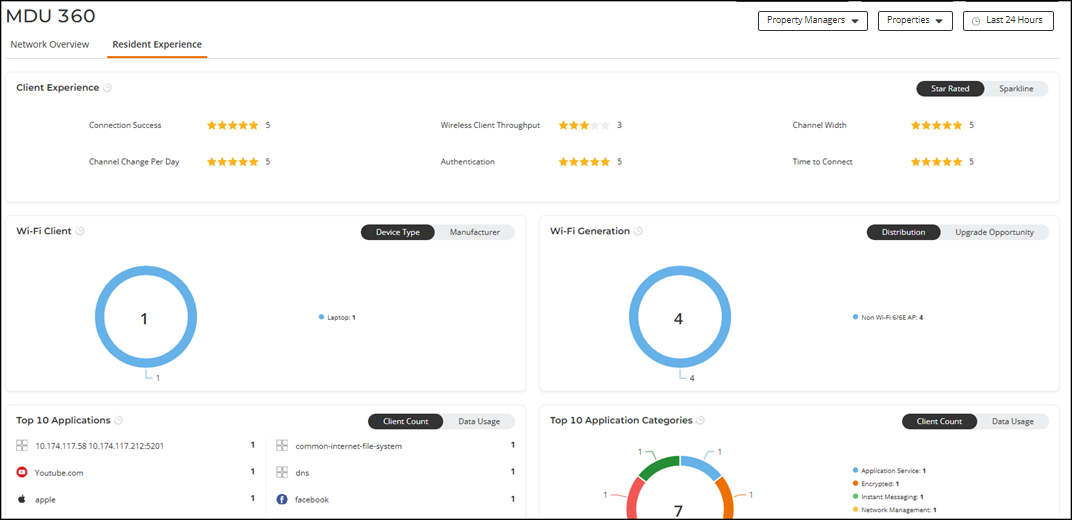
- Client
Experience: The widget displays network health details
for connected clients across the Property Managers. Thresholds for these
metrics must be configured in the Key Performance
Indicators widget. Key indicators such as Connection
Success, Wireless Client Throughput, Channel Changes Per Day,
Authentication, and Time to Connect are shown as star ratings in the
Star Rated view. Clicking a star for any
indicator opens the Client Experience sidebar
revealing the number of Property Managers per star rating and allowing
you to select a specific star rating to view the list of Property
Managers having that rating. The same Client Experience data is also
represented as percentages in the Sparkline view.
In the Star Rated view, properties with a larger number of residents are given greater weight when calculating the overall aggregated star rating. This means that the resident count influences the final rating more significantly for bigger properties.
The star ratings are assigned as follows:
- Top 15% (85% – 100%): ★★★★★ (5 Stars)
- Next 15% (70% – 85%): ★★★★☆ (4 Stars)
- Next 15% (55% – 70%): ★★★☆☆ (3 Stars)
- Next 15% (40% – 55%): ★★☆☆☆ (2 Stars)
- Below 40% (0% – 40%): ★☆☆☆☆ (1 Star)
- Wi-Fi Client: The widget displays the total number of connected devices (such as laptops and smartphones) as a pie chart. You can view device distribution by type using the Device Type view or by manufacturer using the Manufacturer view.
- Wi-Fi Generation: The widget shows the total number of clients connected to the AP generation as a pie chart (newest generation being Wi-Fi 7 AP). In the Distribution view, the total number of clients connected to the AP is displayed as a pie chart. The Upgrade Opportunity view highlights connections between APs and clients, listing older-generation APs that can be upgraded for better performance. A message is displayed to prompt upgrading the APs to the latest generation for improved performance and user experience.
- Top 10 Applications: The widget displays the top 10 applications used by connected clients. The Client Count view shows the number of clients running each application, while the Data Usage view presents data usage for each application in KB, MB, or GB.
- Top 10 Application Categories: The widget displays the top 10 application categories used by connected clients, such as application services, instant messaging, network management, network services, web applications, and so on. The Client Count view shows the number of clients running each application category, while the Data Usage view presents data usage for each application category in KB, MB, or GB as a pie chart and as a list.
- Traffic By Radio: This widget shows the amount of traffic handled by connected clients based on their radio frequency band—2.4 GHz, 5 GHz, and 6 GHz. Data is displayed as a pie chart in the Total view and as a graph in the Trend view (color-coded by frequency band).
- Key Performance Indicators: This widget displays the thresholds set for Property Manager or MSP Customer, including Wireless Client Throughput (Mbps), Time to Connect (seconds), and Channel Changes Per Day. These settings impact the Client Experience widget, reflecting resident experience across selected Property Manager or MSP Customer. The KPI configuration is available for MSP Admin.
- Client
Experience: The widget displays network health details
for connected clients across the Property Managers. Thresholds for these
metrics must be configured in the Key Performance
Indicators widget. Key indicators such as Connection
Success, Wireless Client Throughput, Channel Changes Per Day,
Authentication, and Time to Connect are shown as star ratings in the
Star Rated view. Clicking a star for any
indicator opens the Client Experience sidebar
revealing the number of Property Managers per star rating and allowing
you to select a specific star rating to view the list of Property
Managers having that rating. The same Client Experience data is also
represented as percentages in the Sparkline view.