From the RUCKUS One web interface, you can view the switches that are assigned to a
venue.
Complete the following steps to view details
about switches that are assigned to a particular venue.
On the navigation bar, click
Venues.
The Venues page is displayed.
Click Venue
Name > Devices > Switch. Alternatively, click Number displayed
in the Switches column.
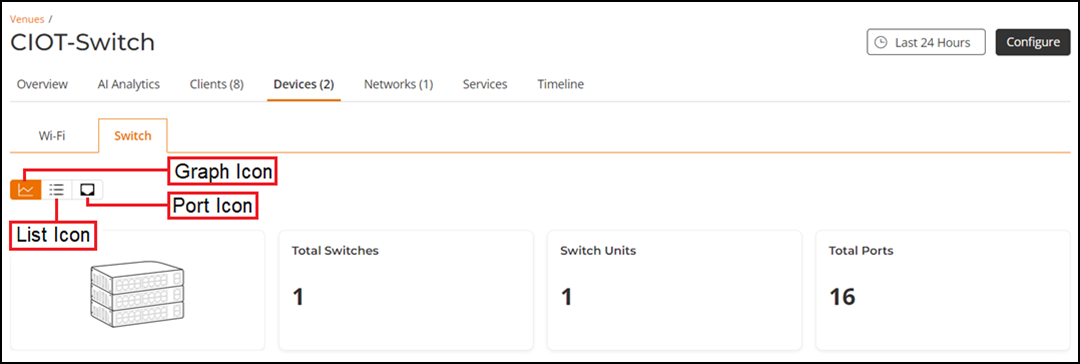
The Switch page is displayed.Switch
Click List icon.
The List tab for the venue appears and displays the following
information about each switch that is assigned to the venue:
Switch: Name of the switch.
Status: Indicates the status of the switch. For example,
if the switch is powered on and is providing networking service to
clients, a green check mark appears with the word Operational next to it.
Model: Model number of the switch.
Admin Password: Admin
password of the switch.
Serial
Number: Serial number of the switch.
MAC Address: MAC address of the switch
IP
Address :IP address of the switch
Venue: The name of the venue to which this switch is
physically connected.
Up
Time : Days and time since when the switch has been
providing service.
Connected
Clients: Number of clients currently associated with the
switch.
Switch List
Click Port icon.
The Port tab for the venue appears and
displays the following information about each switch that is assigned to the
venue:
Port Number: Port number of the switch.
Port Name: Port name of the switch.
Switch: Name of the switch.
Status: Status of the switch.
Admin Status: Admin status of the switch.
Speed: Speed of the switch.
PoE Device Type: PoE type used in the switch.
PoE Usage: PoE usage level in each port of the switch.
VLANs: VLAN assigned to each port of the switch.
Note:
Ensure that you add a switch and allow it to become functional
(Operational status) before checking for tagged
VLANs.
Bandwidth IN: Incoming bandwidth
Bandwidth OUT: Outgoing bandwidth
LAG Name: Name of the Link Aggregation Group (LAG)
Neighbor Name: Name of the next neighboring
device.
Outgoing Multicast Packets: Number of
Outgoing Multicast Packets
Incoming Broadcast Packets: Number of
Incoming Broadcast Packets
Outgoing Broadcast Packets: Number of
Outgoing Broadcast Packets
In Errors: Errors reported for incoming
packets
Out Errors: Errors reported for outgoing
packets
Click the Graph icon.
The Graph tab displays the following switch information: