Monitoring Devices from a Venue Topology Map

The topology map visualizes device connections within a venue, aiding in understanding data flow, troubleshooting network issues, and analyzing device interactions. The devices monitored in a venue are RUCKUS ICX switches and APs.

The devices (switches and APs) must be added to the venue before monitoring them through the topology map.
Follow these instructions to monitor the devices within the venue:
  1. On the RUCKUS One web interface, navigate to Venues.
    The Venues page is displayed providing the list of venues.
  2. Click the venue name for which you want to view the device connections.
    The Overview page for the venue is displayed.
  3. In the Topology / Floor Plans tile, click Topology.
    The tile refreshes, displaying the topology map of the venue devices, as shown in the figure.
    Monitoring Devices from the Venue Topology Map

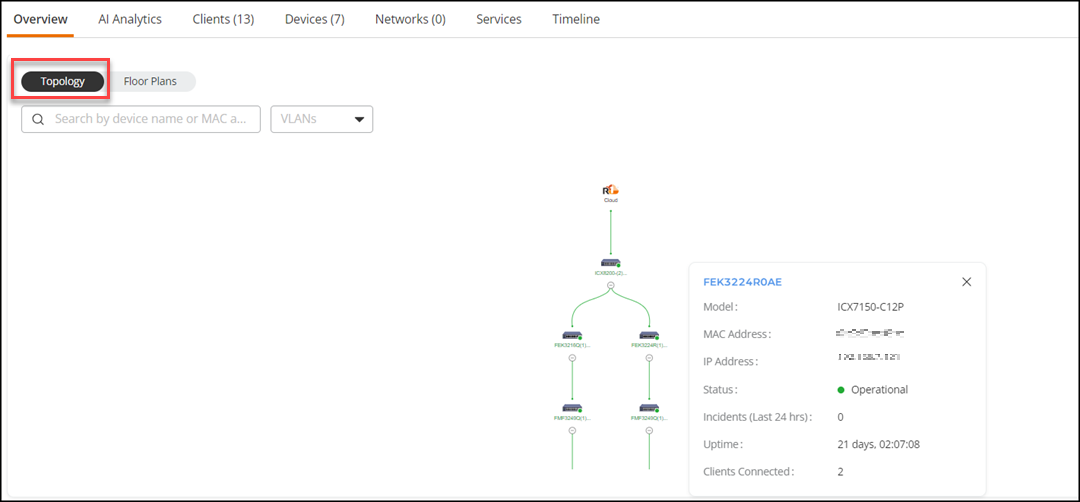
    If your venue has many switches and APs, the search field can help you find the device location within the topology. Type the device name or MAC address in the search field. As you type, the list of matching devices appears. Click on the device in the list to highlight the device icon in the topology map. You can also identify all devices in the venue that are associated with a specific VLAN other than the default (VLAN 1). Click the VLANs drop-down arrow and select a VLAN from the list to highlight the icons for all devices in the topology map. Note that the VLANs list does not include the default VLAN 1.

    You can click on the lines connecting the devices to view more information about the device connections within a venue. Following is an example showing the connection between two switches in a venue. Clicking the line (green) displays the Switch<->Switch window that provides the following information:
    Example: Switch to Switch Connection Details
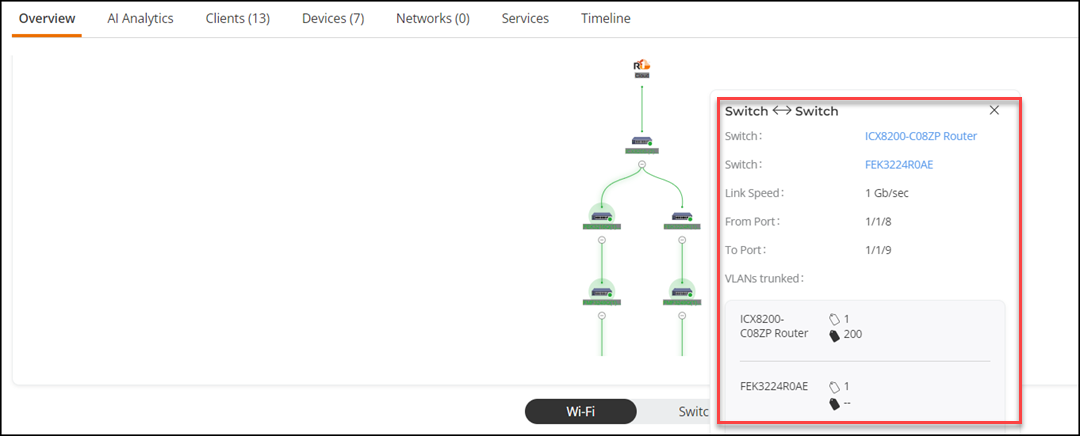
    • Switch: Displays the model number or names of the connected devices (two switch names in this example).
    • Link Speed: Displays the rate at which data is transmitted between the devices in Gb/sec.
    • From port: Displays the port from which data is transmitted.
    • To port: Displays the destination port to which data is transmitted.
    • VLAN Trunked: Displays the VLAN ID and trunk over which information between the connected devices is transmitted.
    The color of the lines connecting the devices indicates the status of the connection between these devices.
    Table 1. Status of Connected Devices
    Connection Status Color of the Lines
    Good Green
    Degraded Yellow
    Disconnected Red
    No Information Grey
  4. Click on a device icon to see more information.
    The following information is provided for ICX switches:
    • Device Name: The name of the device appears at the top of the pop-up window. You can click on the device name to go directly to the Overview page for that device.
      Note: This action will take you away from the Overview page of the venue.
    • Model: Displays the model number of the device.
    • MAC Address: Displays the MAC address of the device.
    • IP Address: Displays the IP address for the device.
    • Status: Displays the status of the device. Options include Operational, Disconnected, Degraded, and No Information.
    • Incidents (Last 24 hrs): Displays the number of incidents that occurred for the device during the last 24 hours. If there are incidents, you can hover your cursor over the color-coded bar to view the number of incidents per severity.
    • Uptime: Displays the duration for which a device has been running without interruption. It is usually expressed in days, hours, minutes, and seconds.
    • Clients Connected: Displays the number of clients connected to the device.

    The following information is provided for APs:

    • Device Name: The name of the device appears at the top of the pop-up window. You can click on the device name to go directly to the Overview page for that device.
      Note: This action will take you away from the Overview page of the venue.
    • AP Model: Displays the model number of the device.
    • MAC Address: Displays the MAC address of the device.
    • IP Address: Displays the IP address for the device.
    • Status: Displays the status of the device. Options include AP Operational, Disconnected, Degraded, and No Information.
    • Incidents (Last 24 hrs): Displays the number of incidents that occurred for the device during the last 24 hours. If there are incidents, you can hover your cursor over the color-coded bar to view the number of incidents per severity.
    • Health: Displays the health of the device. Options include Excellent, Average, and Poor.
    • Wireless Radio: Displays the RF channel, bandwidth, and TX power for each radio in the device.
    • Clients Connected: Displays the number of clients connected to the device.
    • Last Seen: Displays the date and time that the device was last seen by RUCKUS OneRUCKUS One.
    • Mesh Role: Displays the role of the device if part of a Mesh configuration, otherwise displays disabled.
    • Connected APs: Displays the number of clients connected to the device.